
Maintenance and Reliability Professionals
You Deserve to Spend Your Expertise on Strategy, Not Spreadsheets
Stop wasting time with manual reporting and outdated tools. Master Power BI and learn how to build powerful maintenance and reliability dashboards that help you get the most out of your data, improve plant performance, and transform your career.
Your Expertise Is Being Wasted
You didn't spend years mastering maintenance and reliability to become a spreadsheet jockey. But that's what manual reporting turns you into.
Meanwhile, the industry is changing. Data-savvy managers are demanding insights, not spreadsheets. AI is transforming how we work. The professionals who can turn data into clear, actionable dashboards are the ones getting noticed, leading projects, and advancing their careers.
You should be at the forefront of this change – not stuck with clunky tools and a reliance on others to get the data you need.
Here's the truth: skilled professionals like you shouldn't have to waste their expertise on repetitive admin. Your knowledge should drive decisions, not disappear into spreadsheets.
Without these skills, you risk being left behind – still compiling reports manually while others lead with data.
There's a better way. And you don't need IT or expensive consultants to do it.
Not Sure Where You Stand?
Take the free 3-minute Maintenance Intelligence Maturity Assessment and discover where your team is on the journey from spreadsheet chaos to data-driven decisions.
Power BI Training Built for Maintenance Professionals
Most Power BI courses are built for generic business users. They teach you features, not solutions. You finish with knowledge but no idea how to apply it to maintenance and reliability.
MaintenanceDataPro is different. Every course is built around the dashboards and KPI systems M&R professionals actually need – by someone who's spent their career in your industry.
You won't learn Power BI in the abstract. You'll build tools you can use at work tomorrow.
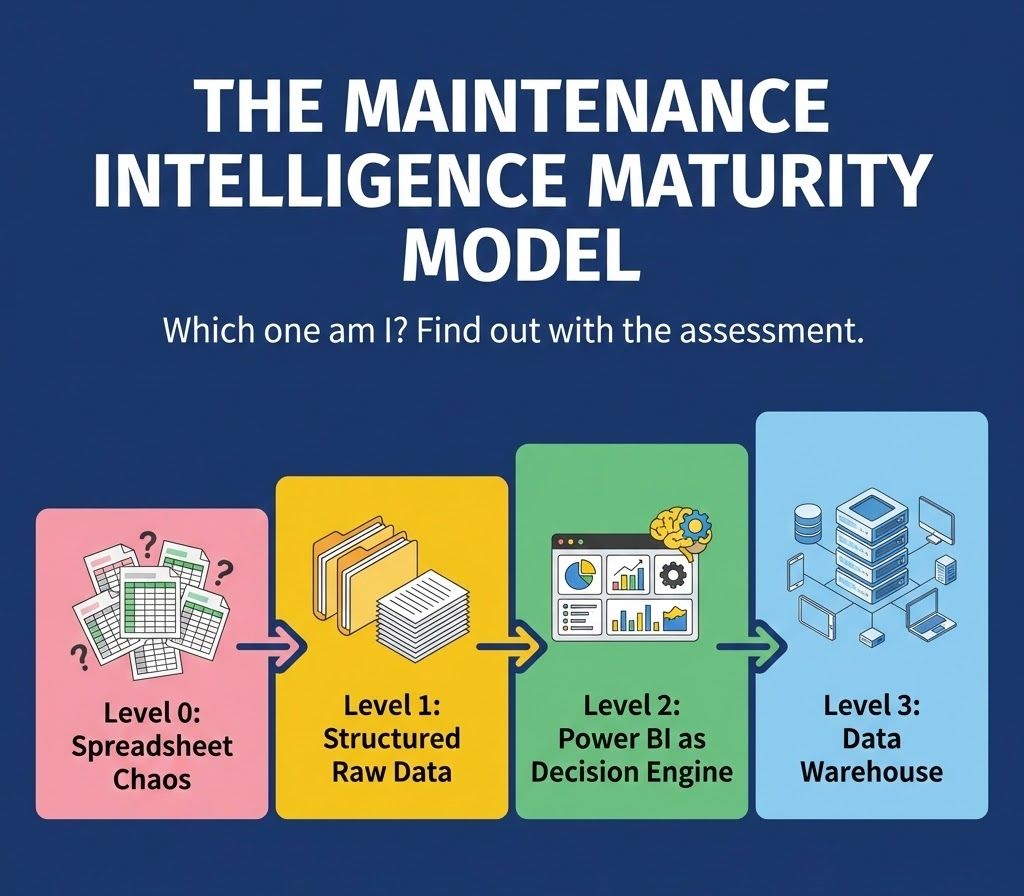
The Maintenance Intelligence Maturity Model
Most M&R teams are stuck at Level 0. Here's the path from chaos to control:
Start Your Modernisation Journey
Whether you're new to Power BI or ready to automate your KPI reporting, there's a path to help you unlock the full potential of your maintenance data.
Power BI Quick Start
Build your first maintenance dashboard in under 90 minutes
See what's possible - no experience needed
Best for: Level 0 → Level 1
FREE
Power BI Quick Start Plus
Build a complete work order tracking report from scratch
Walk away with a completed work management dashboard
Best for: Level 0 → Level 1 → Level 2
$200
KPI Performance Management
Build an automated KPI reporting system
Transform your reporting processes from passive to proactive
Best for: Level 2 → Level 3
$300
Want both paid courses?
Your Guide: A Maintenance Professional, Not an IT Trainer
I know what it's like to spend your Monday mornings in spreadsheet hell. I've sat through meetings where I presented data that was already out of date. I've felt the frustration of having real expertise but no time to use it.
I'm Jason. I've spent my career in maintenance and reliability – Maximo, SAP, oil and gas operations.
I taught myself Power BI, Power Automate, and Power Apps because I was tired of the way things were. I wanted to get more from the data I was sitting on – and I wanted dashboards that actually helped improve plant performance, not just report on it.
It took time, trial and error, and plenty of mistakes. But I figured it out.
Now I help other M&R professionals skip the struggle and get straight to results.
How It Works
Step 1: See What's Possible (Free)
The Quick Start course shows you how to build a maintenance dashboard in under 90 minutes. No experience needed – just see what Power BI can do for you. You'll know within an hour if my teaching style works for you. No risk, no commitment.
Step 2: Develop Your Skills ($200)
Quick Start Plus takes you deeper. You'll build a complete work order tracking system from scratch and gain real confidence working with your maintenance data. Everything is designed for M&R contexts – not generic tutorials.
Step 3: Transform Your Reporting ($300)
The KPI Performance Management course teaches you to build an automated system that keeps your KPIs current. No more Monday mornings spent compiling data. Focus on improving performance, not creating reports.
No IT background required. If you can use Excel, you can do this.
What You Can Expect
- ✓ No IT dependency — create dashboards without waiting for IT
- ✓ Zero fluff — only the 20% of Power BI that delivers 80% of results
- ✓ M&R relevant — every lesson designed for maintenance work
- ✓ Data you can trust — replace risky manual processes
- ✓ Practical from day one — build a real dashboard as you learn
- ✓ Progress safely — no data warehouse required to start
Where This Takes You
Picture walking into your next meeting with confidence. Your dashboards updated automatically overnight. Your KPIs are current. Your insights are strategic – because you had time to think.
You're no longer the person buried in spreadsheets. You're the professional who turned data into decisions. The one leadership turns to when they need answers.
That's not a fantasy. That's what happens when you stop wrestling with manual processes and start working smarter.
- Spend hours on strategy, not data entry
- Present insights that are current, not outdated
- Be seen as a data-driven leader, not a report generator
- Have skills that are in demand across the industry
Ready To Start?
The free Quick Start Course takes 90 minutes. You'll build a real dashboard. And you'll know if this is right for you.
Already done the free course? Click to explore paid options
Not sure where to start? Take the 3-minute Maturity Assessment
